Years of practice
Developed since 1999, open source since 2014
Projects worldwide
Applied on six continents across every sector
Daily practitioners
Used by professionals, governments, and universities
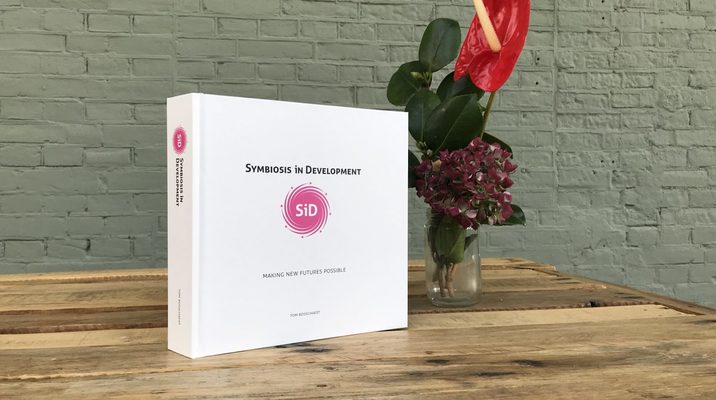
SiD is open source and free to use, supported by the Except Integrated Sustainability foundation, the open source community, and a global network of partners.
A systemic approach to sustainable development
SiD connects systems thinking, resilience science, and practical design tools into a unified open framework, enabling professionals to create solutions that regenerate rather than deplete.
SiD brings together holistic system thinking with actionable bottom-up solutions, while including all aspects of sustainability. It covers everything from circular energy, materials, ecosystems and biodiversity to culture, a just economy, health and happiness. The modular setup allows inclusion of custom tools and methods. Any tool that helps analysis, development, or design plugs directly into the process. It is flexible enough to apply at any scale: from a single product to a city, from a company to an entire sector.
"A system is a set of things interconnected in such a way that they produce their own pattern of behavior over time. The system, to a large extent, causes its own behavior."Donella Meadows, systems analyst
What SiD brings to your work
Six integrated capabilities that turn complexity into clear, actionable strategy.
Systemic Framework
SiD brings together holistic system thinking with actionable bottom-up solutions, while including all aspects of sustainability.
Integrated Spectrum
SiD covers all aspects that matter to your project, from circular energy, materials, ecosystems and biodiversity to culture, a just economy, health and happiness.
From idea to action plan
SiD supports the entire life cycle of a project, from team building to idea development in co-creation, concept building, and the implementation of action plans.
Flexible and extensible
SiD’s modular setup allows inclusion of custom tools and methods. Any tool that helps analysis, development, or design plugs directly into the process.
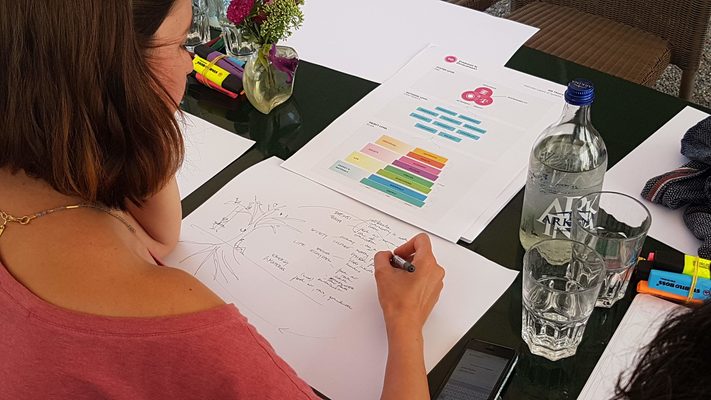
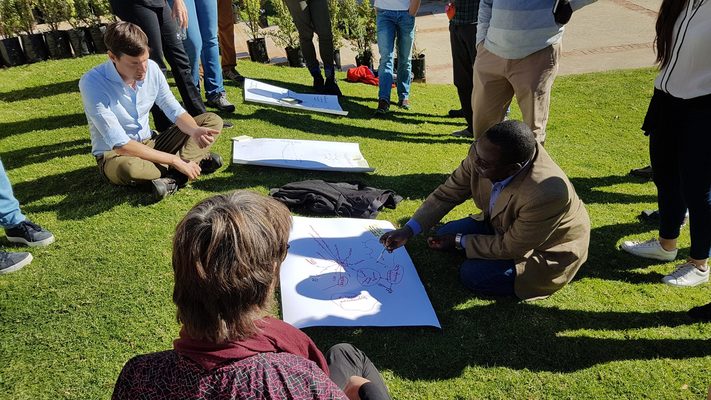
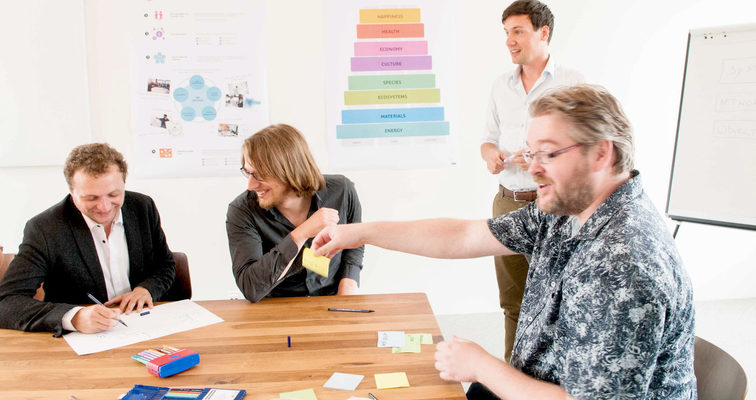
Co-Creation
Work in co-creation sessions with multi disciplinary teams. Explore all aspects of your challenge together, across all layers of society.
Stakeholder involvement
SiD integrates stakeholder involvement to ensure understanding, adoption, and continuity of complex projects.
Get Started with SiD
Documentation
Read the expanding series of online documentation, or download the Quickguide PDF.
Learn SiD
Free video lessons, exercises, and guided learning paths. Earn badges and certificates at your own pace.
Find a Professional
Hire a professional or a team to run a SiD project for your challenge.
Case Studies
See how SiD has been applied across industries, governments, and communities worldwide.
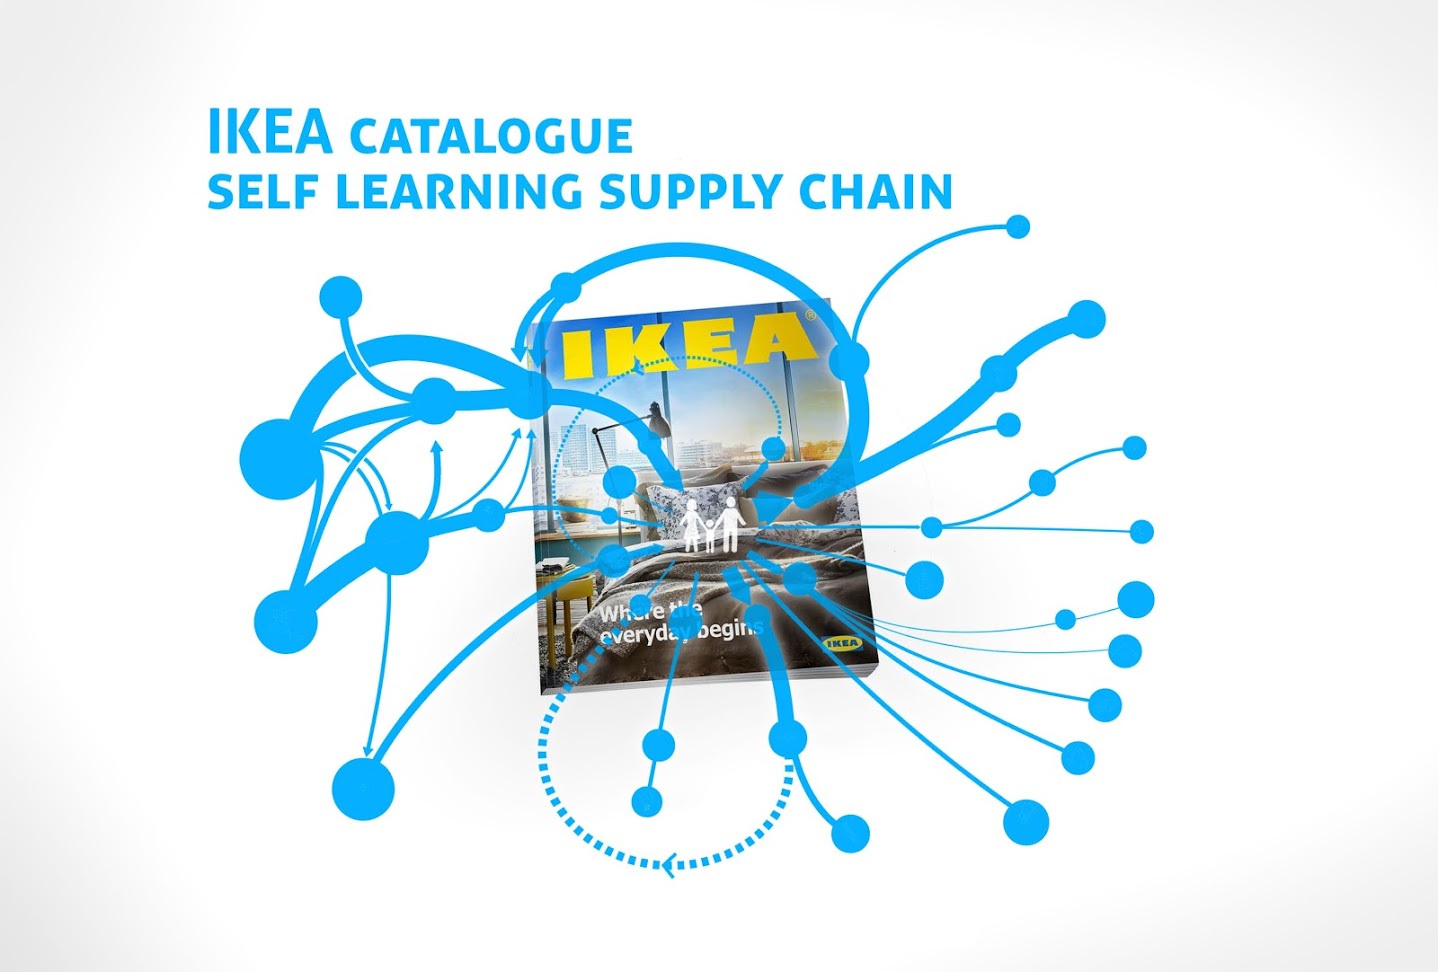
IKEA Self-Learning Supply Chain
Applying SiD to transform one of the world's largest supply chains into a self-learning, adaptive system.
Brighton Design Futures
A community-driven design process reimagining urban futures for the city of Brighton, UK.
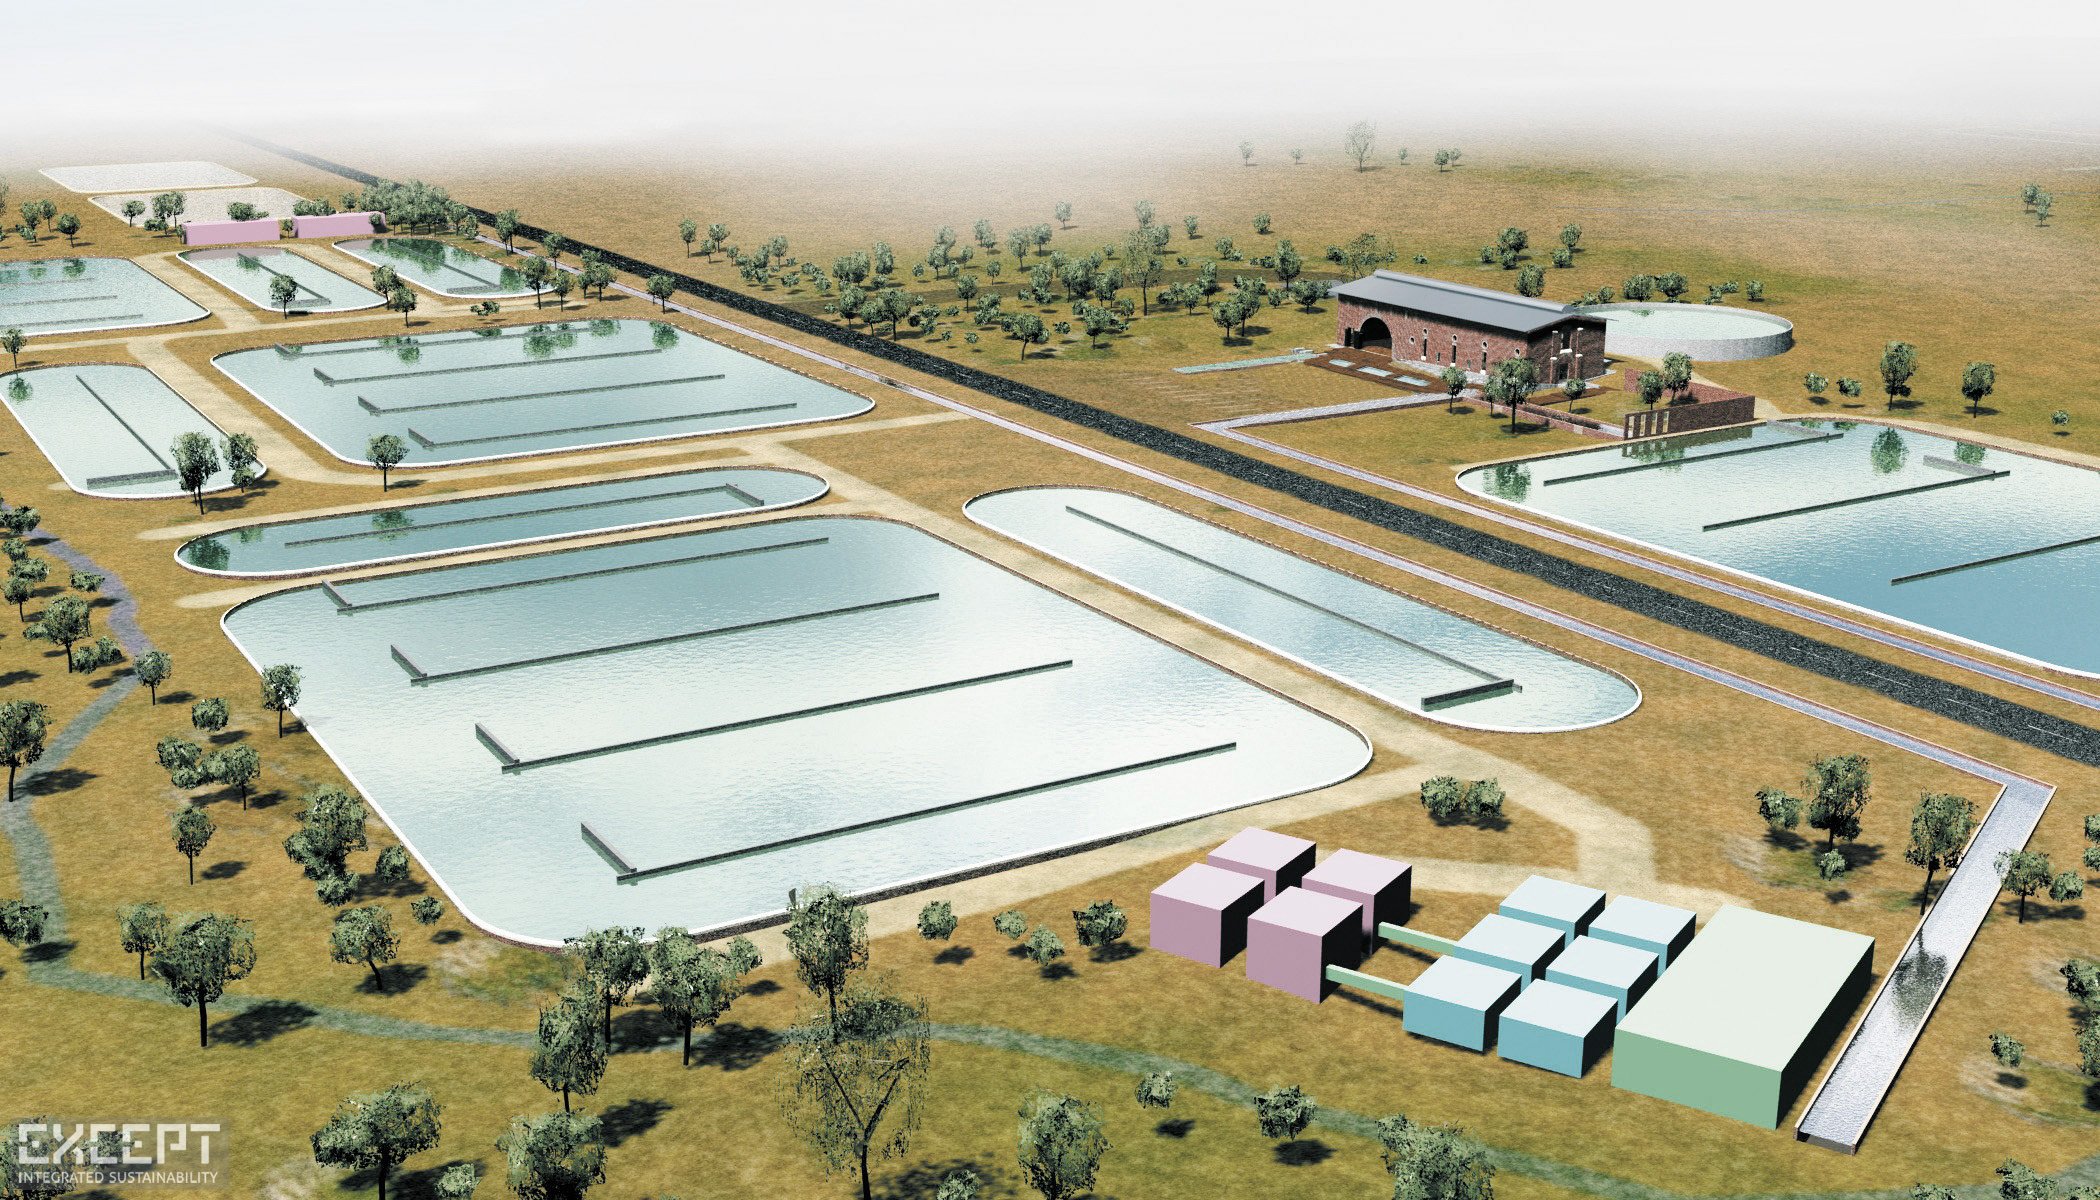
Merredin Spirulina Farm
Designing a regenerative spirulina algae farm in the Australian outback using symbiotic principles.

Heineken: 100% Circular
Using SiD to develop a systemic roadmap for fully circular and energy-neutral brewing operations.
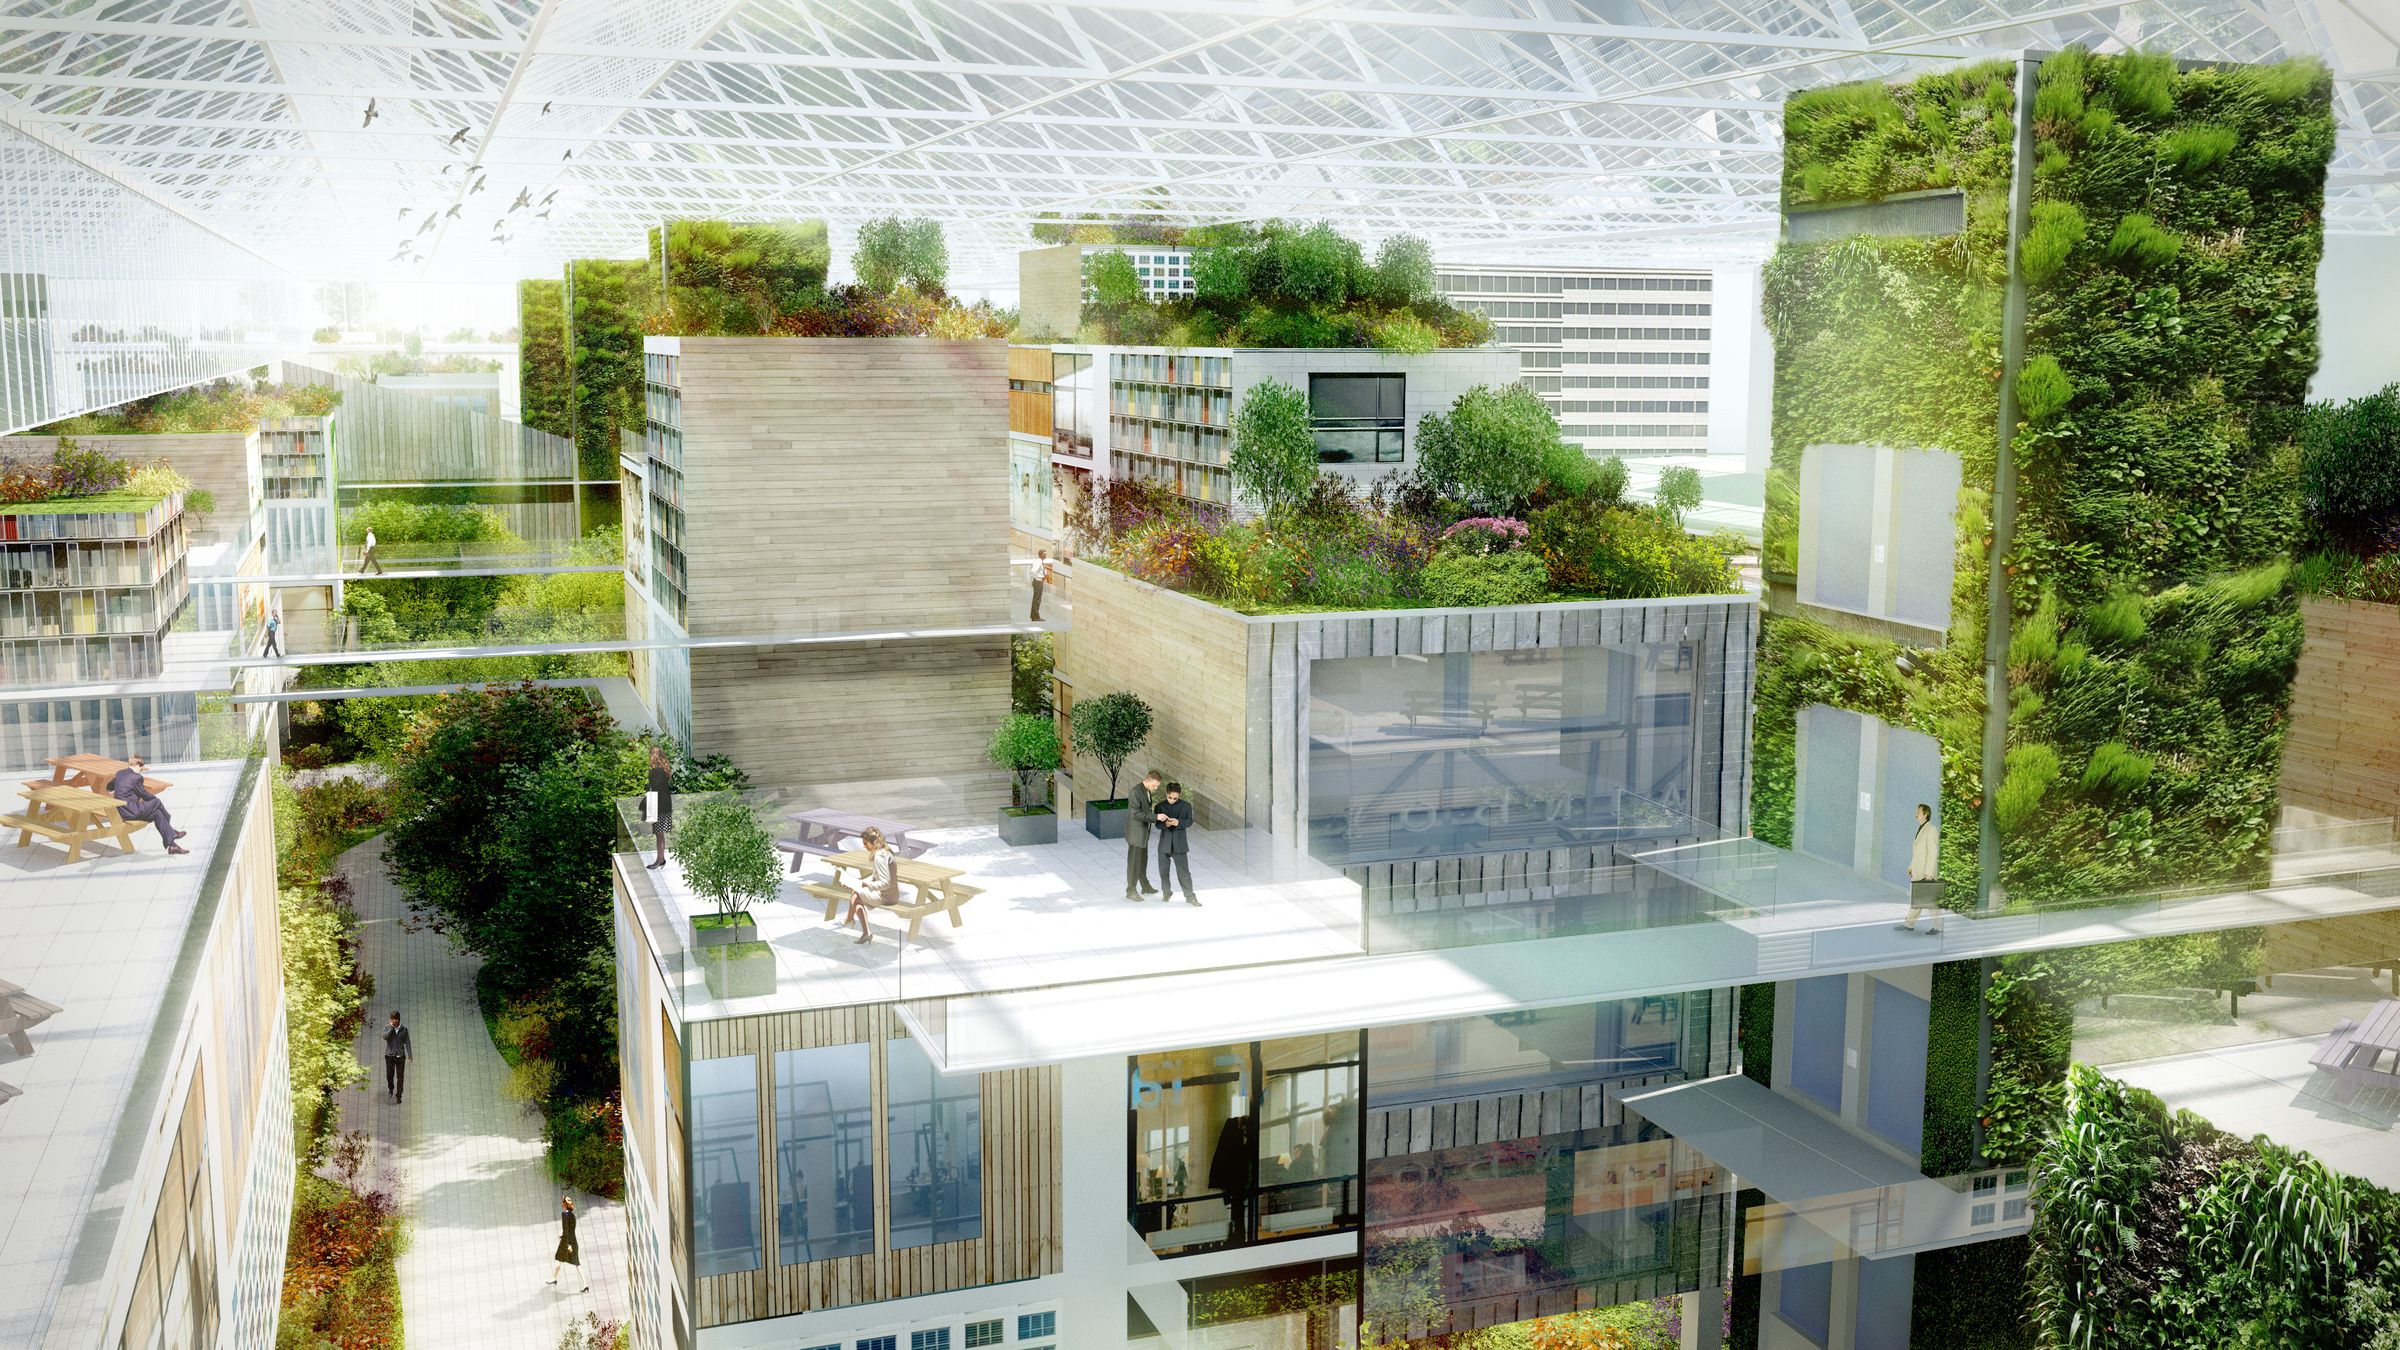
Schiphol Catalyst Office
Applying SiD and ELSI to design a catalytic, circular office concept at Amsterdam Airport.

Pizza 4P's: Sustainable F&B
Crafting a 15-year sustainability roadmap for Southeast Asia's pioneering restaurant chain.
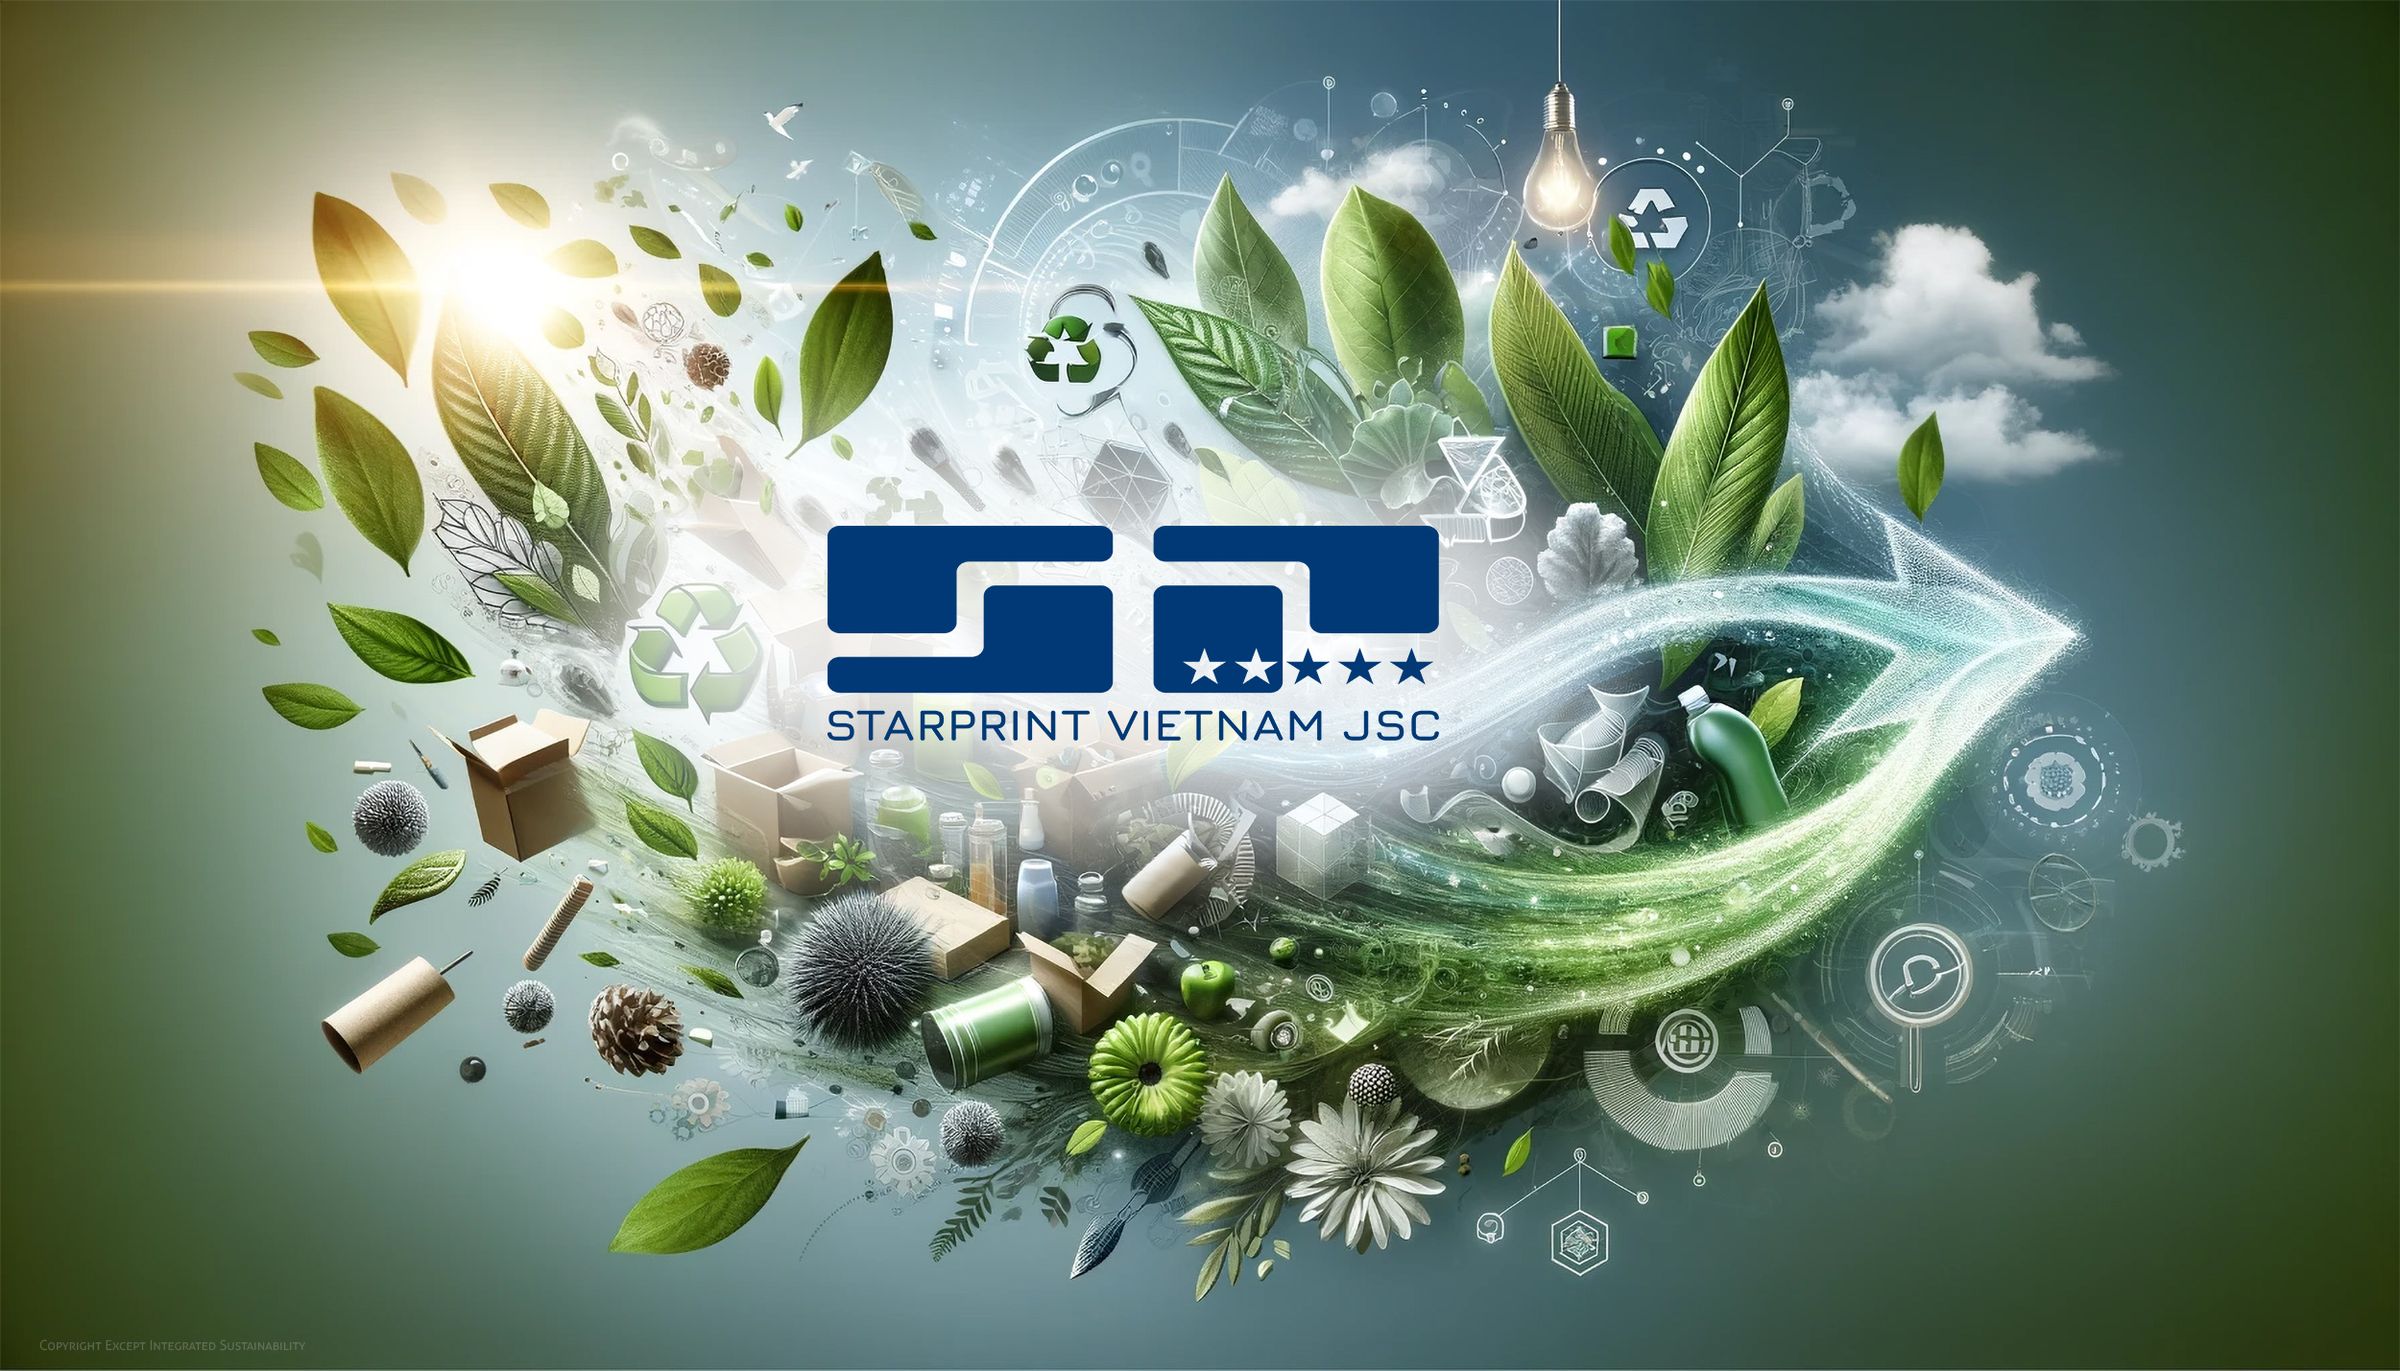
Starprint Vietnam
Building a sustainability transition roadmap for Vietnam's packaging industry using SiD.

Sircle Collection Hotels
Developing an organization-wide sustainability vision for 13 hotels across four European countries.
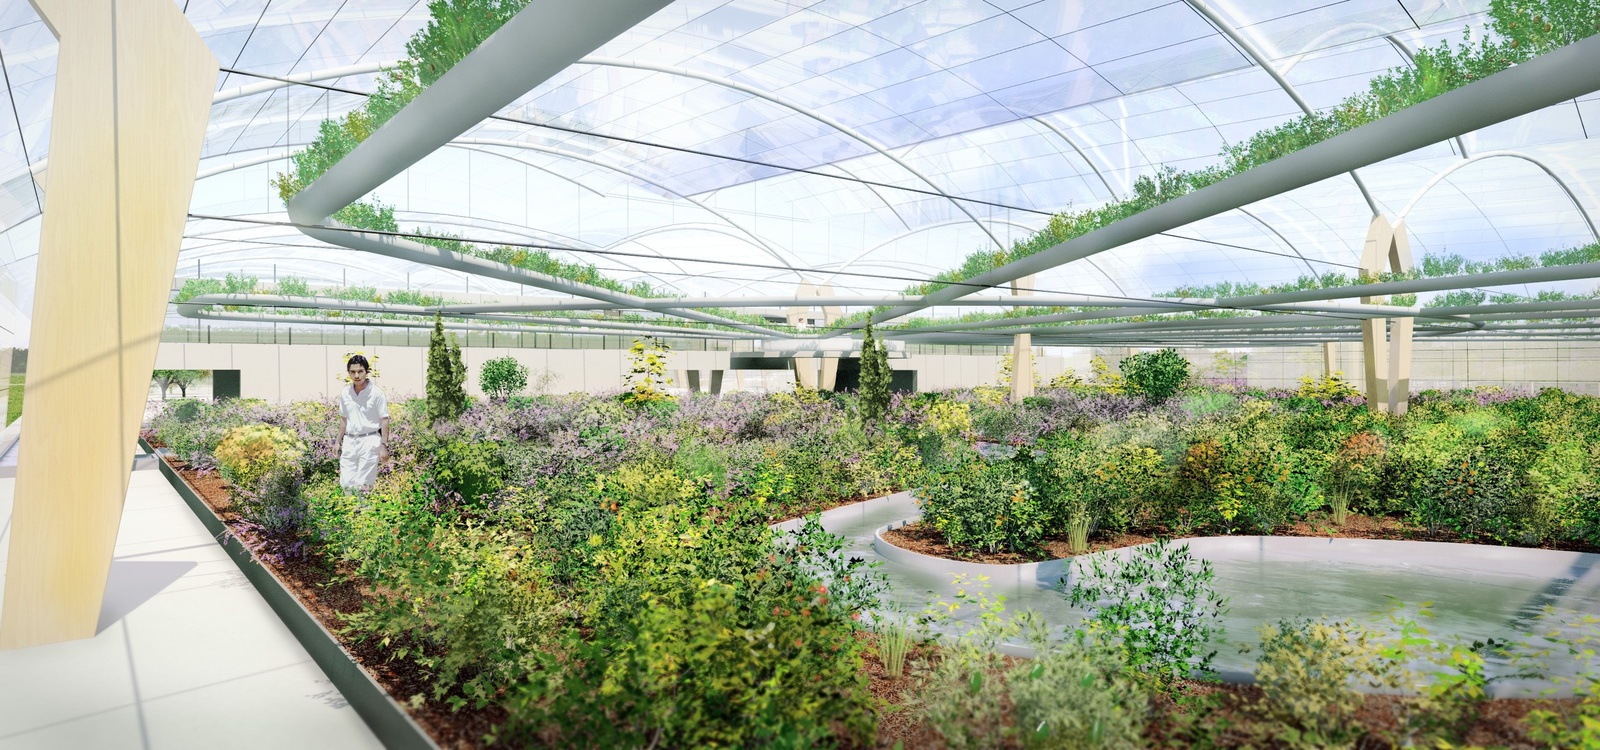
Polydome
Revolutionary polyculture greenhouse producing over 50 crops, livestock, and honey in a closed-loop system.
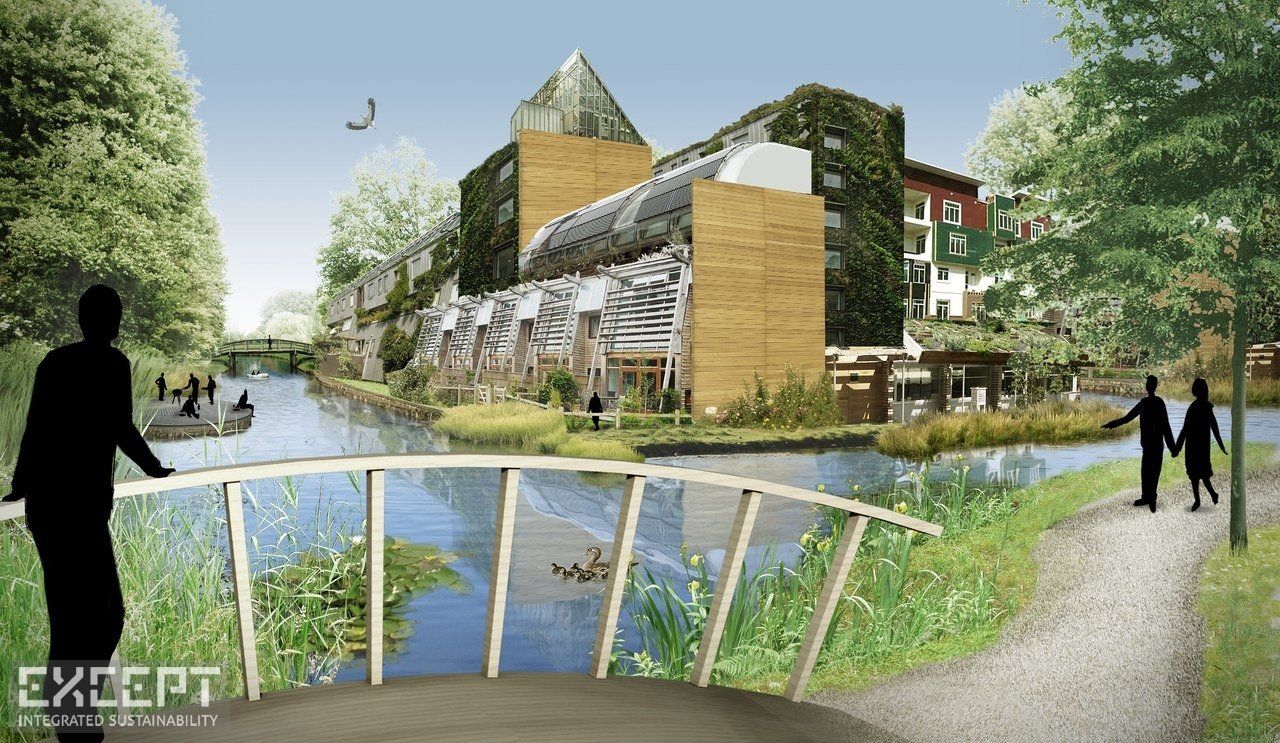
Schiebroek-Zuid
Complete sustainable transition plan for post-war social housing in Rotterdam using SiD.
What People Say
SiD is the best method embracing the complexity in system-design for sustainability I have so far experienced. I was looking for a teaching method that does not just ease our remorse. SiD honours not falling into that trap.Andreas WengerHead of Institute for Interior Design and Scenography, FHNW
It truly challenges people to think outside the box, to think of solutions they didn't even realise were within the realm of possibilities, and come up with a result that is of much greater impact than the sum of its parts.Jeroen van der VlistUrban Planner
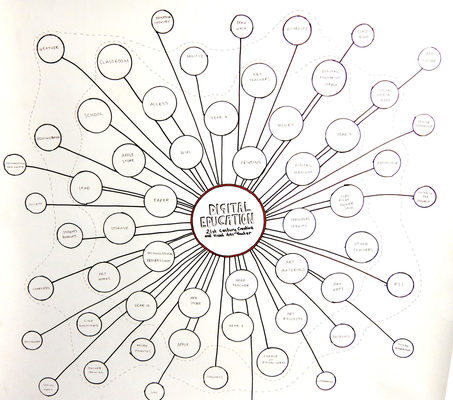
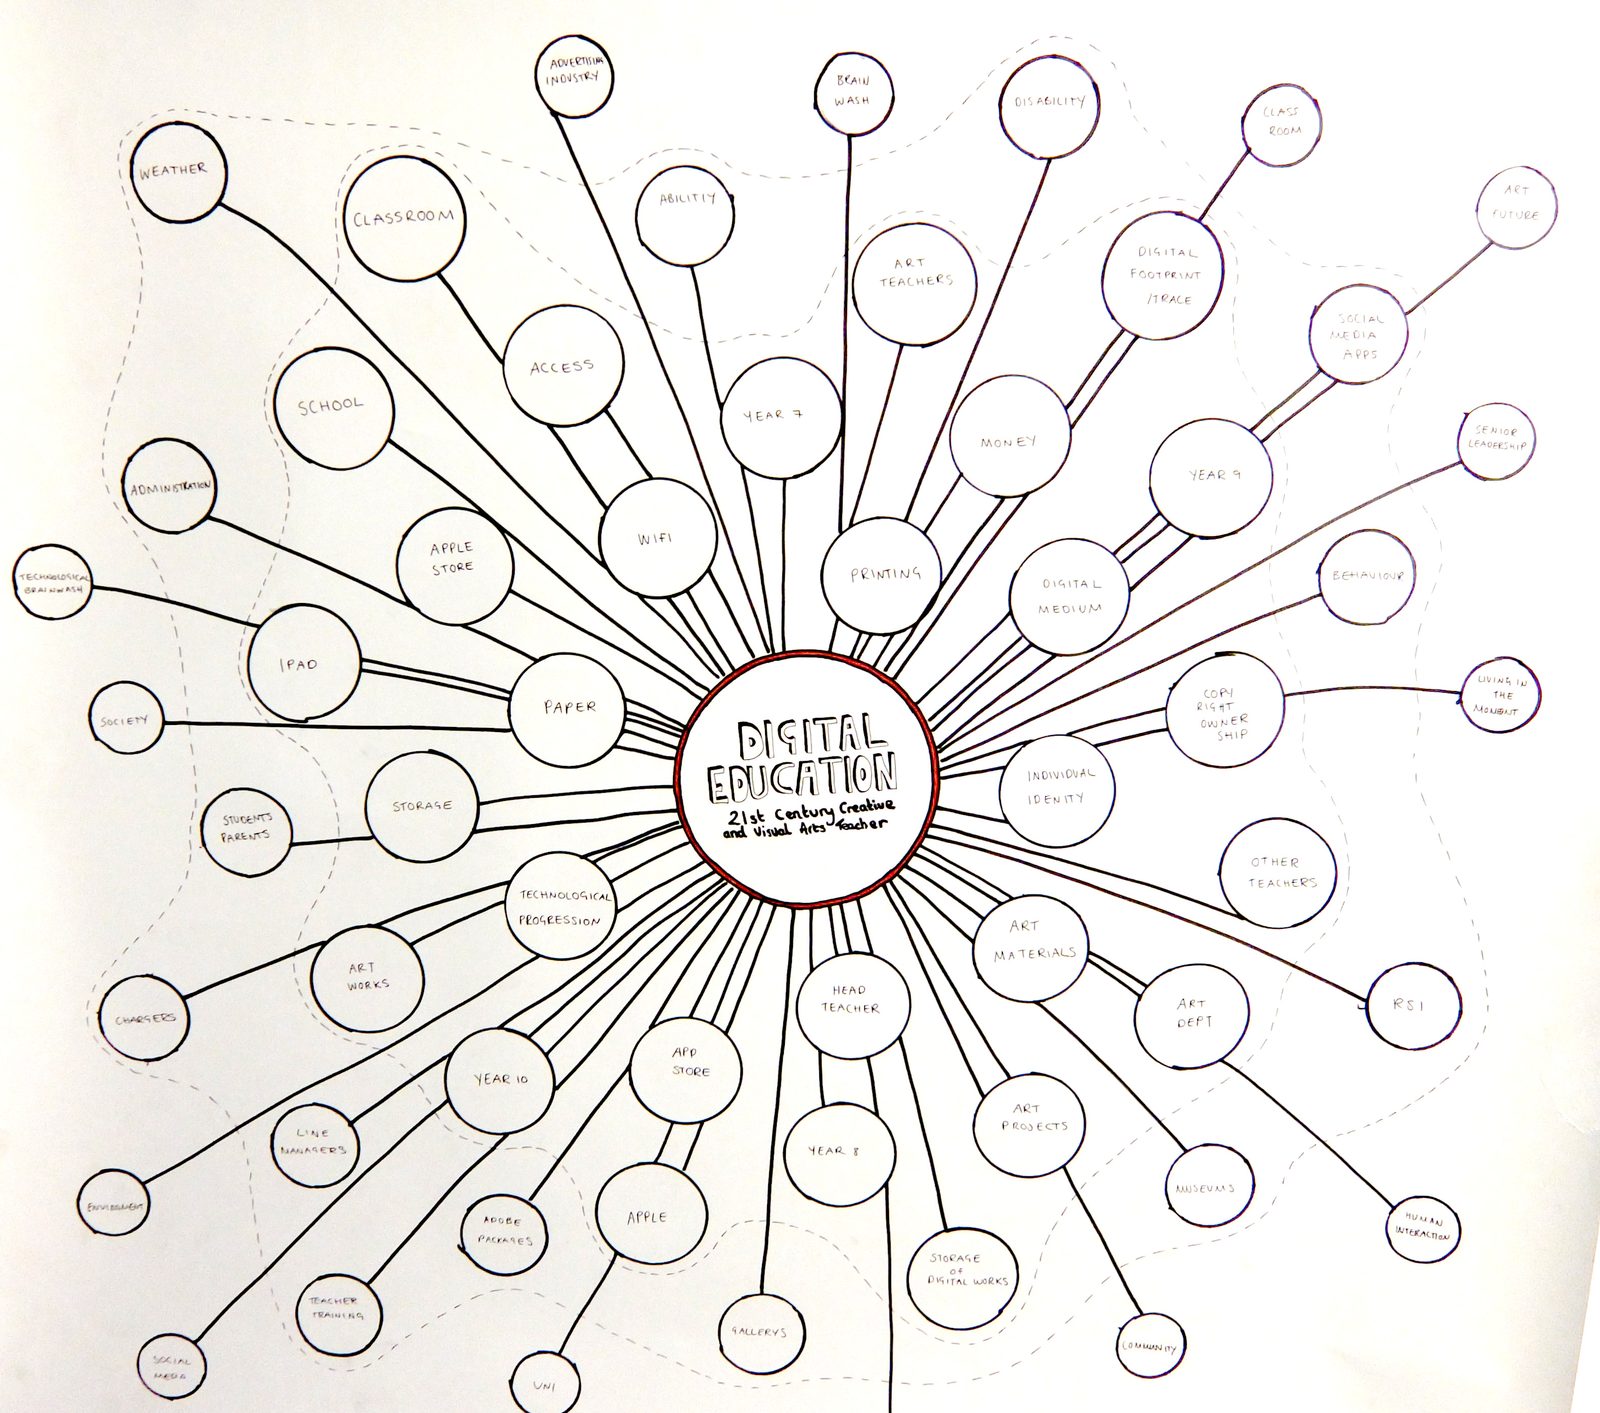
After attending the SiD training, we used the systems- and network-related concepts and tools to mindmap the relationships of all the different sustainability areas of interest. The exercise greatly helped the Government we were advising to set the right priorities.Mark BoumanDirector, Urban Reality
By my knowledge, SiD is the only practical systems approach that provides insights, a methodology and practical tools for governments and companies to properly deal with sustainability.Michiel van der VightSustainability Advisor
The SiD training provided me with a practical yet theory-backed perspective on pathways towards sustainability, which makes me feel empowered in my work and opens up a whole new perspective on, basically, everything.Paula LandSiD Trainee
My time with Except enabled me to reframe the concept of sustainability in my mind, from a business objective to a business opportunity. From that new mindset, I was given the tools needed to start planning.Timen SwijtinkFounder, Lacaph Coffee
The SiD training provided me not only with practical system-thinking tools and methods to be applied when working with clients; it changed my perspective on society as a whole as well, enabling me to see things more clearly and interconnected.Mirjam SnitjerProject Coordinator, IDEO
The SiD training gave me the tools to apply the abstract concept of system thinking to the pragmatic world of design.Angela Grecoir., Engineer
Latest Content
64 learning units across three guided paths. Earn badges, track your progress, and get certified.
Welcome to SiD
Your entry point to the framework. Three video lessons covering what SiD is, how it works, and why it matters.
The Essentials
A curated track for decision-makers. Covers the essentials of systems thinking and the SiD method.
SiD Overview
A comprehensive introduction to the Symbiosis in Development framework and its core principles.
What is Sustainability?
Explore how sustainability is defined, why conventional definitions fall short, and how SiD builds a systemic alternative.
The 5-Step Method
From goals and indicators through system mapping, understanding, solutioning, to evaluation. 15+ video lessons.
ELSI in Detail
Understanding the Environment, Liveability, Social, and Institutional dimensions of sustainable systems.
RAH System Indicators
Resilience, Autonomy, and Harmony: the three meta-indicators that guide systemic evaluation.
The Complete Program
The complete academic journey through SiD. Theory, method, process, and tools. All 59 units with video lectures, exercises, and AI feedback.
Support Open Sustainability
SiD is free and open-source, developed by the Except Foundation. Your donation helps keep it accessible to everyone.