
System Mapping
Step 2: Where Are We Now?
If you are planning a route, you first need a map. For complex systems, no map usually exists, and we typically lack insight into the system at the outset. This step collects information and represents it so we can learn from it. First we make maps to explore; later (in Step 4) we create "desired state" maps as before-and-after pictures of the transformation.
Types of System Maps
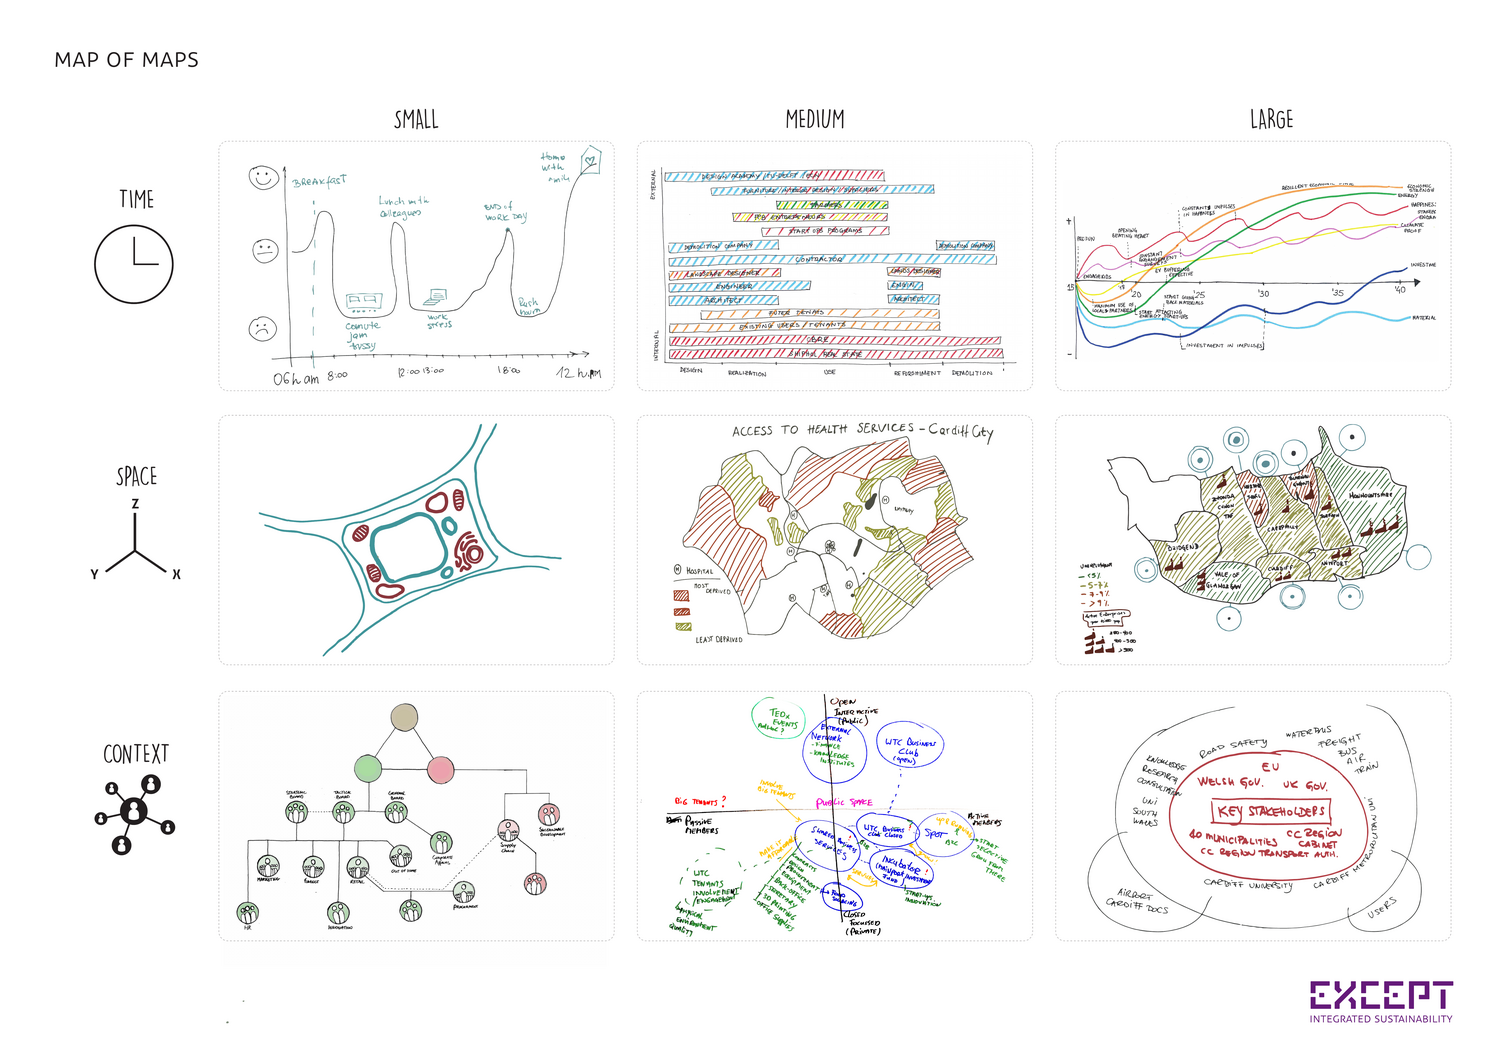
The SiD SNO hierarchy ensures information is collected in an integrated way across four map types:
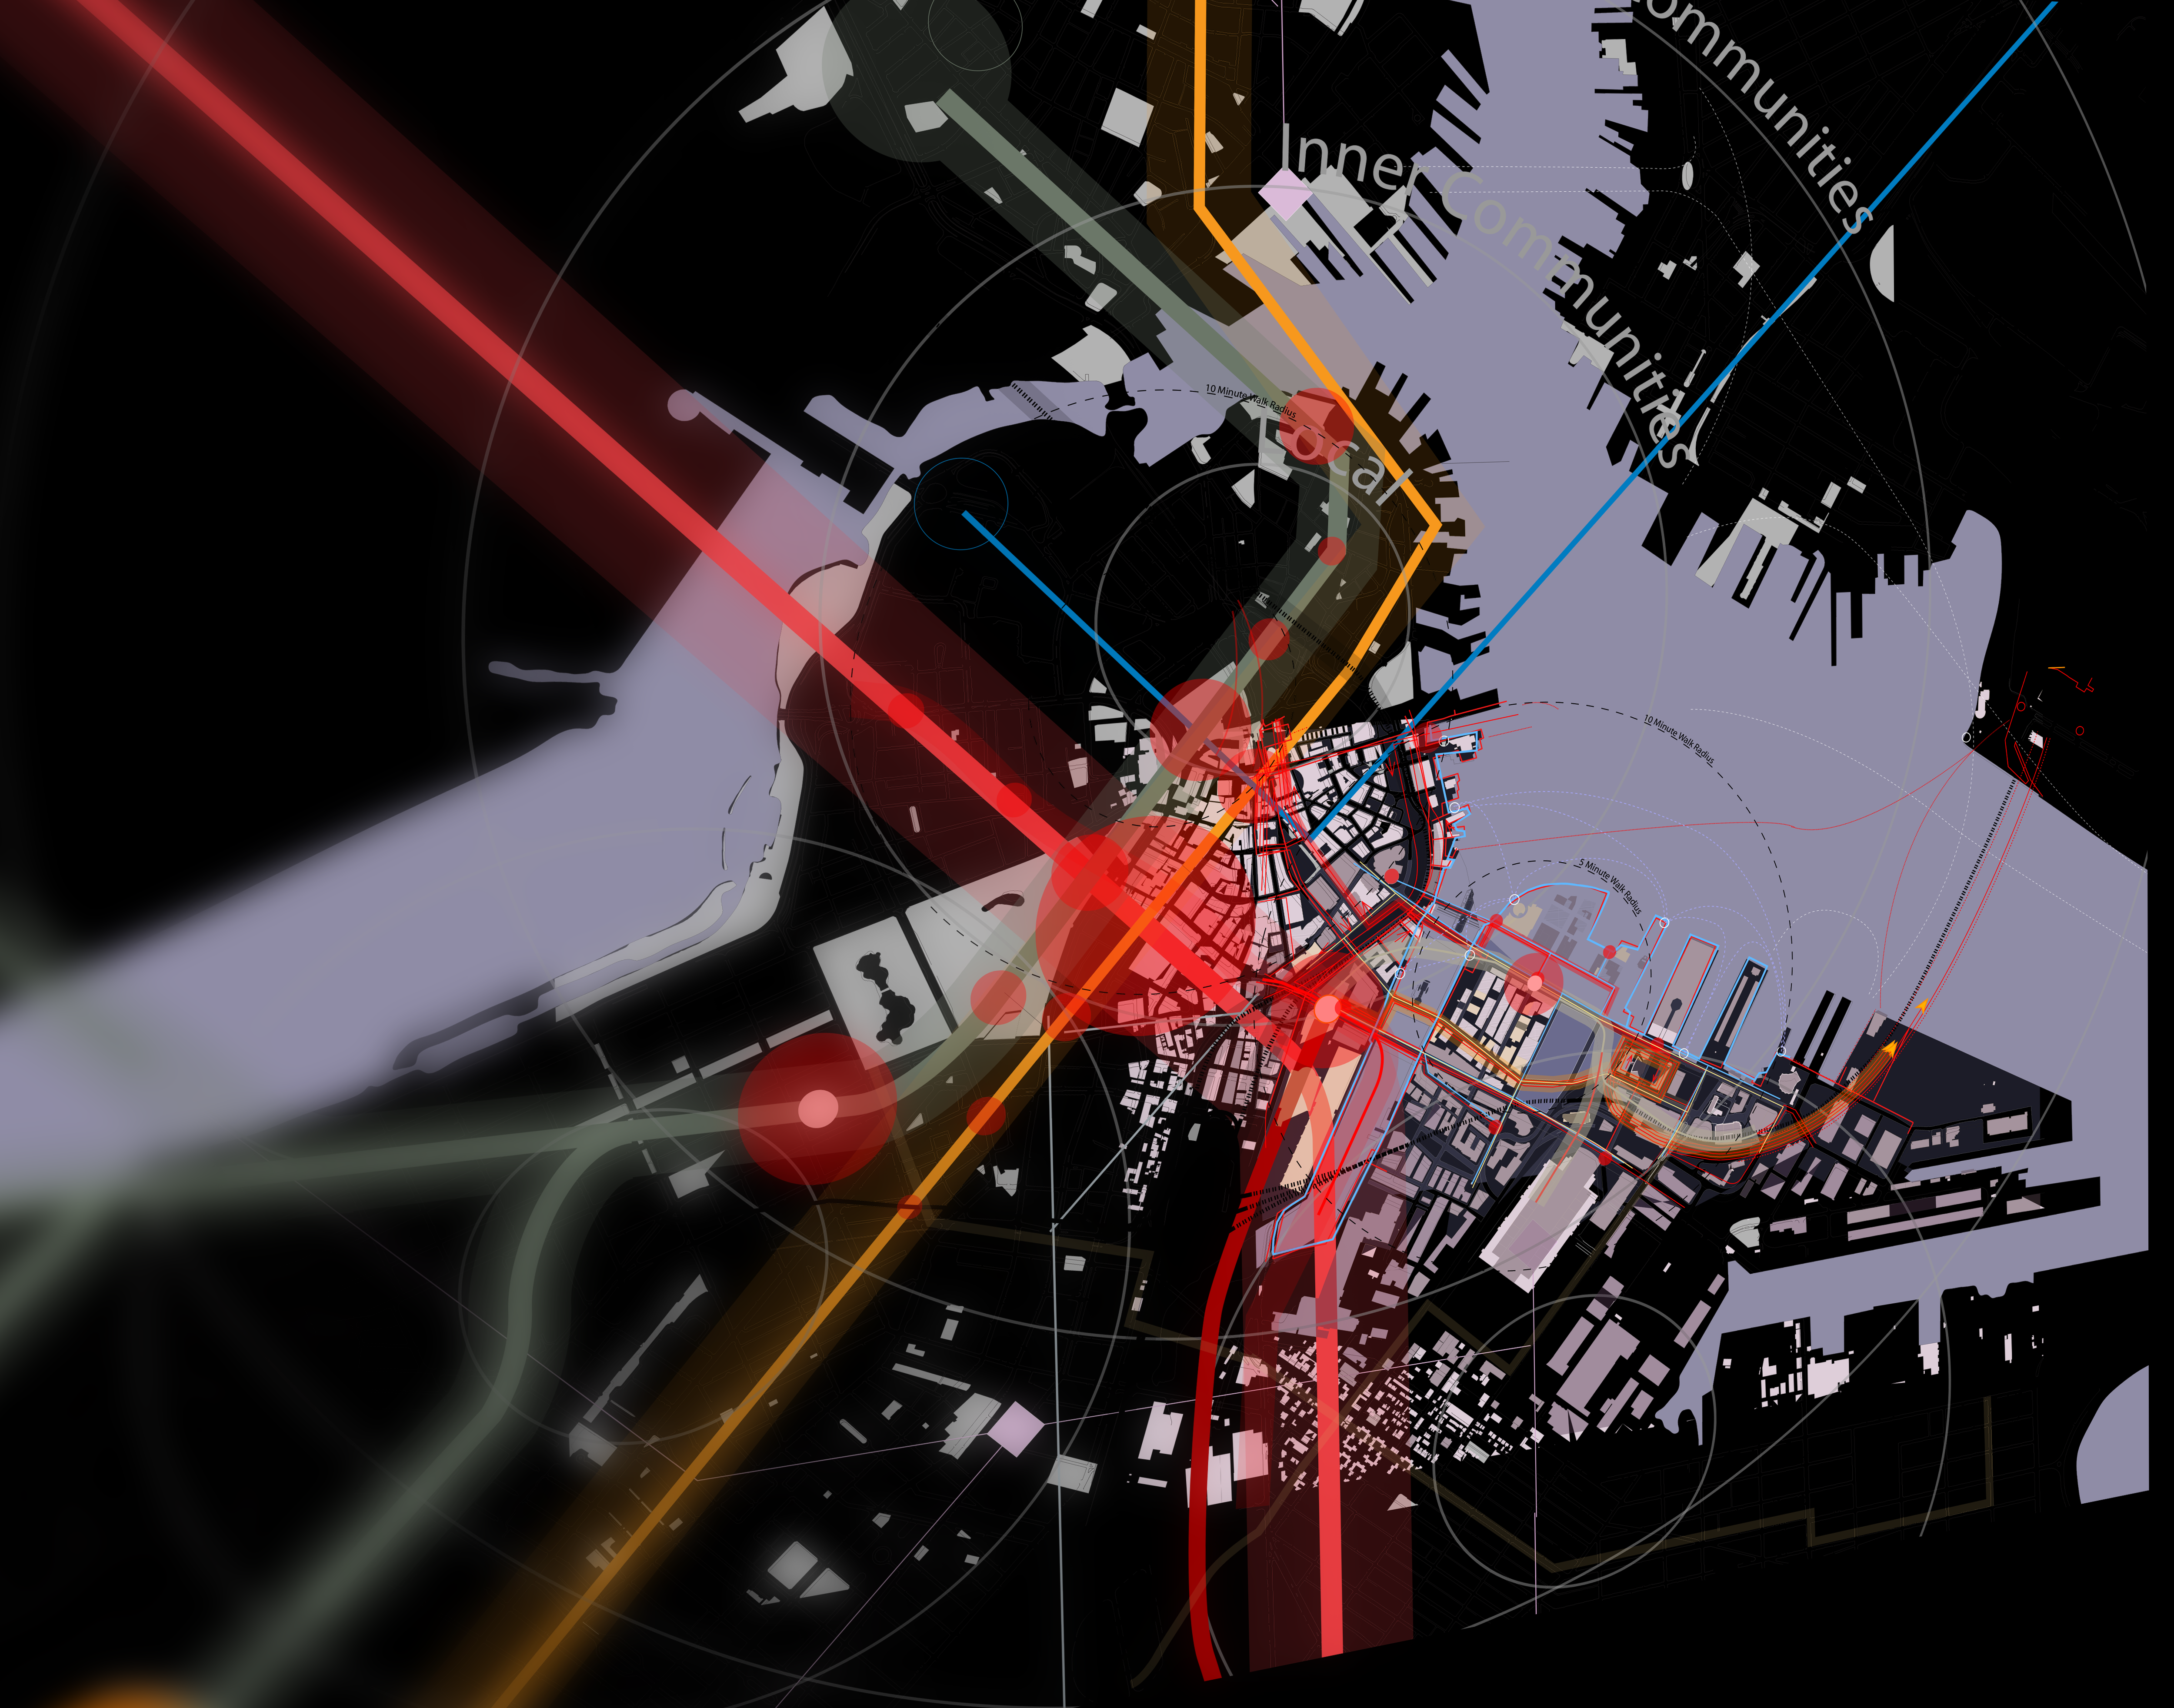
Spatial maps show physical relationships: resource flows, movement of people, ecosystems, and infrastructure in geographic space.
Temporal maps show how the system changes over time: past behavior, current state, and projected futures. Timelines, trend charts, and historical analyses are common forms.
Context maps show relationships freed from spatial and temporal constraints. Causal loop diagrams, stakeholder maps, organizational charts, value chain diagrams, and ELSI impact scans are all context maps.
Network maps show transparency, connectivity, and relationships between different areas of the system, revealing how information, resources, and influence flow through the network.
The Mapping Process
Start broad and coarse, then refine in subsequent cycles. The first pass might take a few hours, capturing the most obvious elements. Later cycles add depth. A practical starting technique: make a quick grid with two vertical and two horizontal lines, creating nine areas. Fill in what subject and map type you can create for each cell. This 3x3 matrix ensures coverage across scales and dimensions.
Map the full spectrum. Use ELSI categories to avoid missing entire domains of impact.
Involve diverse perspectives. A biologist maps ecosystem flows; an economist maps market dynamics; a designer maps user experiences. Together they capture the whole system.
Let the process teach. The act of mapping is often what brings insight. Some system maps are completely illegible to others, but for those who made them, the process was the key to understanding. Maps are not infographics; they are working tools.
Keep it accessible. Maps do not need to be beautiful. Sketches on napkins, Excel tables, sticky notes on walls: whatever captures the relationships most effectively. Feel free to experiment with formats.
From Maps to Understanding
The maps produced here feed directly into Step 3: System Understanding, where patterns are identified and genuine comprehension of the system develops. The quality of understanding depends directly on the breadth and depth of the mapping effort.