Intelligence Phase
The intelligence phase is where you build the knowledge foundation that everything else rests on. Before you can understand a system, you must map it. Before you can map it, you must collect the data. Before you can collect data intelligently, you must know what you are looking for. The intelligence phase is a structured approach to building comprehensive understanding through systematic research, analysis, and preparation.
Once the team is formed and aligned on the project's direction, the work begins. The intelligence phase collects all the information required to analyze the system and prepare for the co-creation sessions that follow. This includes determining what data to acquire, sourcing it, organizing it, and preparing it for system mapping.
The intelligence phase serves the method. Everything collected here becomes input for the method cycles in the next phase. System maps will be drawn from this data. Stakeholder engagement will be informed by it. Solutions will be tested against it. The quality of your intelligence determines the quality of everything downstream.
The Intelligence Steps
The intelligence phase may include any or all of the following:
- Data collection
- Market analysis
- Trend analysis
- Precedent analysis
- Stakeholder analysis
- Systems analysis (initial mapping)
The depth and breadth of each step depends on the project. A small community project may spend two days on intelligence. A national policy program may spend months.
Data Collection
For every project, you need data. The first task is to identify what data you need. The second is to organize how you will collect and store it. The third is to divide collection tasks among team members and execute.
Use an ELSI sweep as a starting point. Walk through the eight ELSI categories (Energy, Ecosystems, Materials, Economy, Health, Happiness, Culture, Species) and ask: what data do we need in each category? What do we think we will find? This also establishes a documentation structure that keeps everything organized as the volume grows.
Data falls into three categories by dimension:
Space data. Climatic data, cultural information, soil conditions, biodiversity levels, resource availability, infrastructure maps, geographic relationships. These feed directly into spatial system maps.
Time data. What has been planned for the future? What historical patterns exist? Are there strategic outlook documents, government policies, demographic projections, economic forecasts? Review year reports. Extrapolate development curves. Identify upcoming legislation. These feed into temporal system maps and inform trend analysis.
Context data (relational). What is the decision-making structure? Where does the subject sit in its supply chain or life cycle? What stakeholders are involved? What third parties are affected? What geopolitical circumstances apply? These feed into context system maps: causal loop diagrams, organizational hierarchies, material flow analyses.
Data collection can be time-consuming, especially when dependent on delivery from external institutions. Start early. Process everything into a shared reference document or database so all team members have equal access.
Market Analysis
Depending on the challenge, analyze the market from an integrated perspective. This may include scanning the existing market landscape, analyzing competition, reviewing voluntary sustainability standards, and mapping supply chains and value chains.
Use ELSI as a departure point for market analysis. This automatically surfaces aspects like employment markets, natural capital pricing, resource availability, and regulatory environments that a conventional market analysis might miss.
A particularly useful exercise is mapping the life cycle of the challenge subject from primary resources to end of life, combined with the supply chain from source to end user and the value chain showing business models. If these maps are prepared as visual "before" maps, they become powerful tools during co-creation sessions, inviting stakeholders to design the "after" state.
Trend Analysis
Trend analysis scans for long-term societal dynamics that will influence the project over its full time horizon. Trends are not predictions. They are patterns of change that have been building and can be expected to continue, at least directionally.
Trend analysis is vital for medium to large projects. For small projects, reusing trends from similar previous projects may be sufficient.
Be aware of scale sensitivity. A local trend may run opposite to the global pattern. A short-term trend may reverse over the long term. Both scales are valuable: short-term and local trends align the start of the roadmap; long-term and global trends align the strategy and goals.
Sources for global trends include the World Economic Forum, United Nations agencies, Amnesty International, and large consultancies. Be critical. These reports tend to be biased toward their authors' domains. The WEC, for example, focuses on policy and economics and may entirely miss ecological trends like biodiversity collapse. Use ELSI to check for balance. If any ELSI category is absent from your trend analysis, you have a blind spot.
Local and short-term trends are best extracted from local stakeholders, surveys, and data analysis. Here, the trend analysis and stakeholder engagement processes reinforce each other.
 Precedent Analysis

The purpose of precedent research is to avoid reinventing the wheel and to gather inspiration. Every team member searches for existing resources: prior research, related solutions, case studies, and inspiring examples from adjacent fields.
Organize the search using ELSI categories. This prevents scope narrowing. Great solutions often come from entirely different fields. A breakthrough in energy management might be inspired by logistics optimization. A stakeholder engagement approach might be borrowed from community health programs.
Define a strict recording format before the search begins: name, author, date, short description, source, relevance to the project, and images. A shared online spreadsheet divided by ELSI categories works well. This allows team members to work independently while producing a coherent, combinable output.
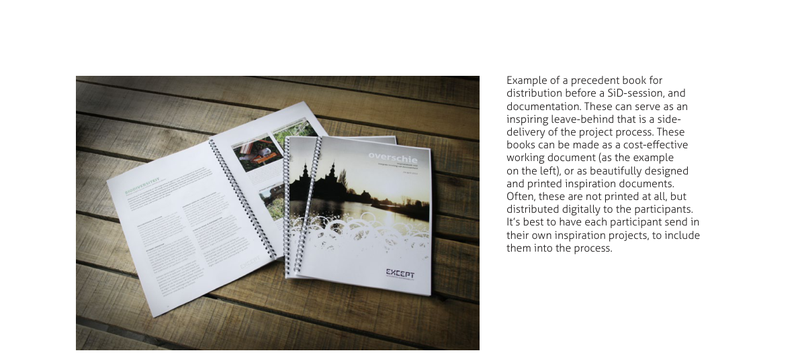
The results are compiled into a precedent book, distributed to all participants before co-creation sessions. In addition, summary posters can be displayed in the SiD session room as background inspiration.
Stakeholder Analysis
Whether the project involves policy, products, organizational change, or area development, stakeholders are always present. The stakeholder analysis identifies who they are, their proximity to the challenge, their interests, their influence, and how they can be involved.
Identify four levels of stakeholders:
- Primary (1-10 parties). Closest to the project: clients, investors, residents, primary decision makers, team members.
- Secondary (10-100 parties). Directly affected: customers, employees, primary suppliers, neighbors, local ecosystems.
- Tertiary (100+ parties). Usually anonymous: downstream value chain partners, regional populations, society at large.
- Future. People and ecosystems not yet in existence who will be affected by decisions made today.
Create a stakeholder map showing relationships, proximity, and influence. Use the stakeholder mapping exercise from the System Mapping unit as your method. The map will inform who to involve in co-creation sessions, what their concerns are likely to be, and how to structure engagement to be productive.
Systems Analysis (Initial Mapping)
After primary intelligence collection, perform an initial systems analysis as preparation for the co-creation sessions. This is a first-pass execution of the system mapping process described in the method. Its purpose is to produce system maps that serve as templates, inspiration, and accessible intelligence input during the intensive co-creation phase.
Typical maps to prepare:
- Context maps: Stakeholder relationship map. Supply chain / life cycle map. Energy and material flow map.
- Space maps: Geographic maps of relevant locations at small, medium, and large scales.
- Time maps: Historical development timelines of relevant market, policy, and ecological trends.
- Network analysis: Qualitative scoring of critical network parameters (CRAFTDCCV, SSCNE, PEAIE) by ELSI category.
Prepare these as large-format posters for the session room walls, and as A3 prints that participants can draw on during working sessions.
The Archimedes Principle
Allow mental rest. Data immersion is necessary, but understanding requires processing time. After an intense period of data collection and initial mapping, let the team take a break. Walk in a forest. Work in the garden. The subconscious mind processes complexity during rest in ways that focused attention cannot. Archimedes did not solve his problem at his desk. He solved it in the bath.
This is not optional. It is built into the SiD process by design. Schedule rest periods between intelligence gathering and co-creation. A weekend between phases is minimum. A week is better for complex projects.
Key Principle: Map Broadly First, Then Deeply
The most common mistake in intelligence gathering is restricting scope too early. Do not limit your analysis to a few categories (only energy, only economics). Map broadly across all ELSI categories, all three dimensions (space, time, context), and multiple scales. Simplify by reducing depth and resolution, not by reducing scope. Otherwise, critical aspects of the system will be missed, and solutions developed later will fail to create the sustainable state you intended.
This knowledge is free because of our supporters. Join them.